
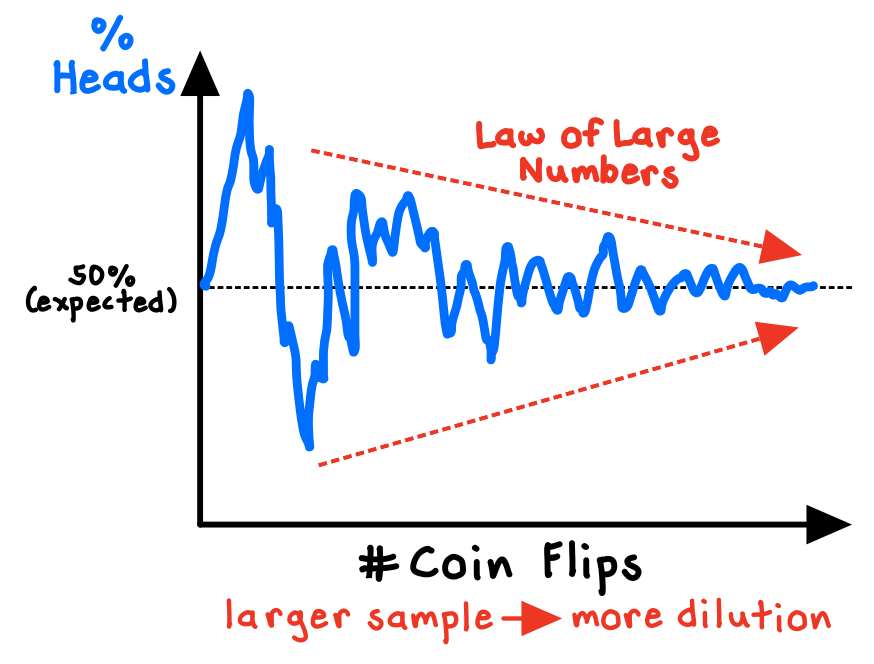
The Law of Large Numbers is a theorem from probability theory which states that in normally distributed systems, as we observe more instances of a random event, the actual outcomes will converge on the expected outcomes. In other words, when our sample sizes grow sufficiently large, the results will settle down to fixed averages.
The Law of Large Numbers, unsurprisingly, does not apply to small numbers. The smaller the sample size, the greater the variation in the results, and the less informative those results are. Flipping a coin and observing 80% “heads” in 10 flips is much less remarkable than observing the same imbalance in 10,000 flips (we would start to question the coin). Larger samples reduce variability, providing more reliable and accurate results.
Delusions of causality
Sadly, people tend to be inadequately sensitive to sample size. We focus on the coherence of the story we can tell with the information available, rather than on the reliability of the results. Following our intuition, we are likely to incorrectly assign causality to events that are, really, just random.
Psychologist Daniel Kahneman famously cites a study showing that the counties in the U.S. in which kidney cancer rates are lowest are mostly small, rural, and located in traditionally Republican states. Though these factors invite all sorts of creative stories to explain them, they have no causal impact on kidney cancer. The real explanation is simply the Law of Large Numbers: extreme outcomes (such as very high or very low cancer rates) are more likely to be found in small samples (such as sparsely populated counties).1
We often foolishly view chance as a self-correcting process. For instance, we might believe that several consecutive successes (in blackjack, basketball, business, etc.) make the next outcome more likely to be a success (the “hot-hand” fallacy). Or, we might believe that a random deviation in one direction “induces” an opposite deviation in order to “balance out” (the gambler’s fallacy).
In reality, the Law of Large Numbers works not by “balancing out” or “correcting” what has already happened, but simply by diluting what has already happened with new data, until the original data becomes negligible as a proportion.2 For instance, as we flip a fair coin more and more times, the proportion of flips that land as “heads” will settle down towards 50%.
This is the logic behind the powerful Central Limit Theorem. Essentially no matter what the shape of the population distribution, for larger samples the average can be assumed to be drawn from a normal “bell-shaped” curve. This theorem provides the foundation for all sorts of statistical tests that help us make better inferences and to quantify uncertainty.3
Correlated errors, and why polls can mislead us
A key limitation of the Law of Large Numbers is that the theorem also requires an assumption that the observations we make are independent of one another (for instance, one coin flip does not impact the next). But if the observations are correlated—as they often are in real life—then what appear to be random results could actually reflect a bias in the method.4 If our data is systemically biased, we are likely to make errors, and we cannot expect the Law of Large Numbers to work like normal.
The potential for correlation between sampling errors was one of statistician Nate Silver’s key insights when he assigned a much higher probability of a Trump victory in 2016 than other pundits estimated. Based on polling data, Hillary Clinton was favored in five key swing states, and analysts surmised that Trump was extremely unlikely to win all of them, and thus extremely unlikely to win the election. Sure, they assumed, Trump might pull off an upset win in one or two of those states, but the Law of Large Numbers should take over at some point.
Silver, however, recognizing that our entire polling methodology could be systematically biased toward one candidate, modeled a healthy amount of correlation between the state polls. His model implied that Trump sweeping the swing states was way more likely than we would expect from the individual probabilities, because a discrepancy between the polls and the results in one state could mean that we should expect similar errors in the other states. Trump won all five of those states, and won the election.5
***
Overall, the Law of Large Numbers demonstrates the incredible danger of relying on small samples to make inferences, the fallacies of assuming that random things are “streaky” or that extreme results will promptly be “balanced out,” and the importance of checking our data for systemic bias—which will lead to misleading results regardless of sample size.
References
- Kahneman, D. (2011). Thinking, Fast and Slow. Farrar, Straus and Giroux. 109-112.
- Ellenberg, J. (2015). How Not to Be Wrong. The Penguin Press. 68-74.
- Spiegelhalter, D. (2021). The Art of Statistics. Basic Books. 236-239.
- Ellenberg, J. (2021). Shape. Penguin Press. 70-74.
- Silver, N. (2017, January 19). The Real Story Of 2016. FiveThirtyEight.