
A power law describes the relationship between two variables in which one variable varies as an exponent of the other. For example, if the side of a square is doubled, the area is multiplied by a factor of four.
Power laws are nonlinear relationships, where the collective output changes by more than the proportional change in input. These relationships contrast sharply with linear functions (which are simpler and more intuitive), where the changes in input and output are proportional.
The dynamics of power laws help describe many extreme phenomena we observe in the world, from natural disasters to the success of startups. Anyone who aspires to maximize their impact can benefit from learning about the nature of power laws—and how to exploit them.
Far from normal
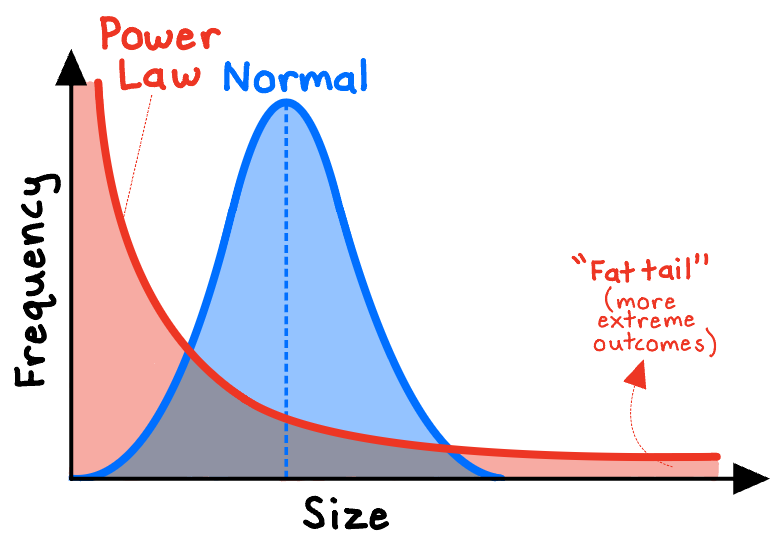
Power laws produce distributions very different from the nice, symmetrical, bell-shaped “normal distributions.” In normally distributed systems, our observations will have a meaningful central tendency (the average) and increasingly rare deviations from that average—such as with human height and weight. Most people aren’t that far from the average height, and the shortest 1% of people and tallest 1% differ in height by only around 14 inches.1
In contrast, the distributions produced by power laws don’t peak around a typical value; rather, the range of values is much wider—with a majority of observations of modest values on one end, and a “fat tail” of rare but extreme outcomes on the other end. While the tallest people in the world aren’t 10x taller than the shortest people, with power laws, the most extreme events can be orders of magnitude greater than the least extreme.
The distributions of a many physical, biological, and man-made phenomena approximately follow a power-law distribution. For example:
- The frequencies of words in most languages — If we want to learn a new language, we would do well to start with the small fraction of words (as few as 135 of them) that make up the majority of usage (“Zipf’s law”).
- The populations of cities — As of 2019, the U.S. had more than 19,000 cities, though just 37 cities housed the majority of the population. The largest one, New York City, housed over 8 million residents alone, more than double the next-closest city.2
- The size of lunar craters — The Moon has countless small craters from millions of years of minor collisions with other interstellar material, and a few enormous craters from exponentially larger collisions.
- The frequencies of family names — There are millions of rare or obscure last names, but approximately 1 in 68 people on the entire Earth has the last name “Wang.”3
- The magnitude of earthquakes — The Richter scale is logarithmic: each increase of 1 on the scale equates to a 10x increase in strength. For instance, a magnitude 5.0 earthquake is ten-times more destructive than a magnitude 4.0 earthquake, but is one-tenth as common.4
Other examples include the size of computer files, the number of views on web pages, the sales of most branded products (e.g., books, music), and individual incomes and wealth.5 In each case, there is a minority that supplies a majority of the outputs.
Sandpiles and avalanches
We should always be wary of the potential for power-law effects whenever we are dealing with systems comprised of many interacting parts—in other words, with complex systems (such as economies, ecosystems, or the climate).6 The various components and the feedback loops that govern them tend to cause such systems to evolve into a very delicate state of balance, a dynamic equilibrium. When forces push the system outside its equilibrium bounds, the system may shift into a new, discrete phase.
As we shall see, when a system “tips” out of equilibrium and into a phase change, the results commonly follow a power-law distribution.
Consider a pile of sand on a countertop. You drop additional grains, one-by-one, onto the pile, steadily increasing the pile’s slope (its key control parameter). At first, each new grain does little; the pile remains roughly in equilibrium. Eventually, however, the pile’s slope will increase to an unstable “critical” threshold, beyond which the next grain may cause an avalanche, a type of phase transition.
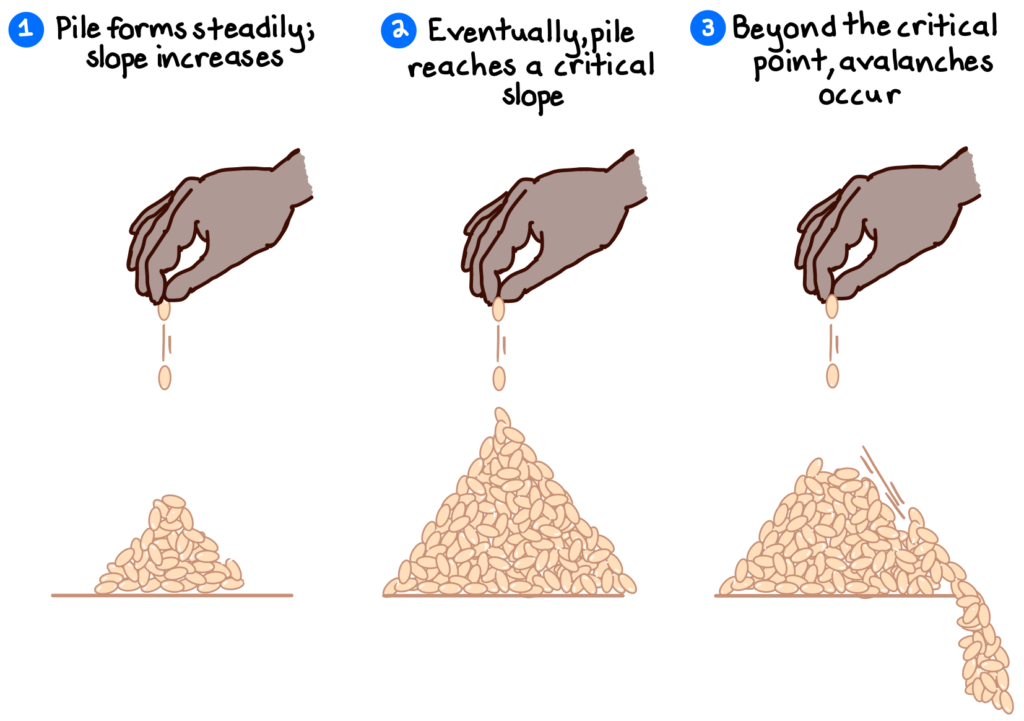
At this critical stage, we can’t say for certain whether the next grain will cause an avalanche, or how big that avalanche will be. We do know, however, that the probability of an avalanche is much higher near the tipping point, and that avalanches of any size are possible, but smaller avalanches will happen far more often. A power law!
We see these same power-law dynamics in all manner of complex systems, which essentially “adapt” themselves through a series of “avalanches” to maintain overall stability.7 Examples include the extinction of species in nature, price bubbles and bursts in financial markets, traffic jams, or earthquakes relieving pressure from grinding tectonic plates.
The engine of venture capital
The dynamics of power laws are central to our economy and to innovation in general. Progress occurs through the trial-and-error process of startups trying new and different ways of creating value. These experiments require financial capital from investors who can accept substantial risk, since most startups fail.
Venture capital investors seek to earn outsized investment returns not by having a large proportion of their investments do well, but having one or two “grand slams” that generate massive returns (think Facebook or Tesla). It would not be surprising for a venture fund’s one or two big winners to return more than all their other investments combined. The most that VCs can lose is 1x their investment, but there is (theoretically) no cap to how much they can gain if an investment is successful.
Union Square Ventures, for example, invested in Coinbase in 2013 at a share price of about $0.20, and achieved a massive return when Coinbase opened its initial public offering at $381 in 2021—a valuation of around $100bn and an increase of over 4,000x.8
Feed the winners, starve the losers
A common corollary to power laws is the “80/20 rule” (or, the Pareto principle), which states that for many events 80% of effects (output) come from 20% of the causes (inputs). Mathematically, the rule approximates a power-law distribution. Phenomena roughly following this rule have been observed in income distribution, software coding, business results, quality control, infection transmission, and elsewhere.
While often the exact number varies, the principle reveals that most of the work we’re doing only generates a small amount of our overall results. The key lies in identifying “the 20%”—of activities, individuals, projects, products, businesses, grievances, etc.—that are driving a disproportionate share of the outcomes, and concentrating efforts towards them.
Corporate “turnaround” master Don Bibeault famously relies on the 80/20 rule to drive transformation in struggling businesses, recognizing that most businesses spend too much time satisfying customers, selling products, and preserving marginal employees that make little or no contribution to the bottom line. The key to implementing an 80/20 policy is redeploying resources away from the “marginal many” to the “critical few” that account for current results and future opportunity—a tactic Bibeault calls “feed the winners and starve the losers.”9
***
Power laws teach us that some inputs are much more important than others, and they can explain many of the extreme results we observe in the world. Concentrating our efforts towards unlocking (or avoiding) the outliers of power laws can provide substantial leverage towards helping us achieve our goals.
When seeking an effective strategy or solution, we should ask ourselves where the most “power” in the situation might be hidden!
References
- United States, Centers for Disease Control and Prevention, National Health and Nutrition Examination Survey. (2020-2021).
- City and Town Population Totals: 2010-2019. (2019). United States Census Bureau.
- Most Popular Last Names in the World. Forebears.
- Harris, T., & Kiger, P. How Earthquakes Work. HowStuffWorks.
- Newman, M. (2005). Power laws, Pareto distributions, and Zipf’s law. Contemporary Physics, 46, 323-351.
- Gribbin, J. (2004). Deep Simplicity. Random House. 145-147.
- Ouellette, J. (2014, April 7). Sand Pile Model of the Mind Grows in Popularity. Quanta Magazine.
- Levy, A. (2021, April 14). Here’s who just got rich from the Coinbase debut. CNBC.
- Bibeault, D. (1998). Corporate Turnaround (2nd ed.). Beard Books.